Text | China Merchants Macro Zhang Jingjing Team
Core view
Under the trend of global economic slowdown, China’s exports exceeded market expectations for two consecutive months, and the market gradually questioned the authenticity of export data. Does the export growth rate exceed expectations mean that the export data is really wet? In other words, is there really no micro-foundation for the export data in March and April? This paper attempts to answer the above questions from multiple angles and state a more objective export view on the basis of multi-dimensional analysis..
The main reason for the high growth rate in March and April is by no means from false reports.Judging from the export "counterfeiting" incident announced in previous years, even excluding the conventional false data, the cumulative export amount from January to April this year was as high as more than 7630 billion yuan, and the cumulative export growth rate was about 10%, which was only 0.5 percentage points lower than the cumulative export growth rate announced by the General Administration of Customs.
Compared with industrial export delivery value, the export volume is more representative of the real export. In March and April this year, the growth rate of export delivery value and the total export volume showed a big deviation, but this is not evidence of false export data.1) The definitions of export delivery value and total export are quite different; 2) From a long period of time, the growth rate of export delivery value and the growth rate of total exports are similar, but for a short period of time, it is not uncommon for them to deviate from each other. In many months, the growth rate of total exports is higher than that of export delivery value. 3) Compared with export delivery value, the monthly growth rate of export volume has obviously changed, which is mainly caused by the statistical method of export volume. 4) It can also be seen from the export sub-items and PMI indicators that the export in March and April did not mainly depend on the industrial enterprises on the regulations.
Does the deviation of import and export growth rate beyond market expectations mean that the authenticity of export data is suspicious?The main commodity structure of China’s import and export is quite different. In the case of PPI price disturbance, the growth rate of import and export often deviates, not only in March and April. Not only is there a divergence in the growth rate of imports and exports in China, but the growth rates of the United States, Japan, the European Union and South Korea, as the main final consumer goods countries, often deviate, and more often, the growth rate of imports is greater than that of exports, which is mutually evidenced by China’s role as a big producer.
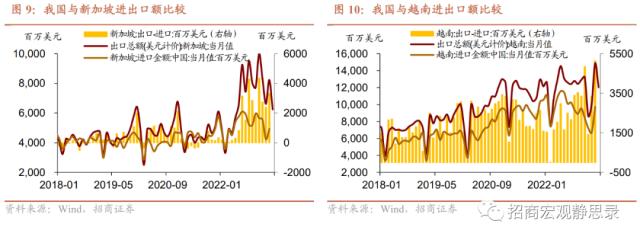
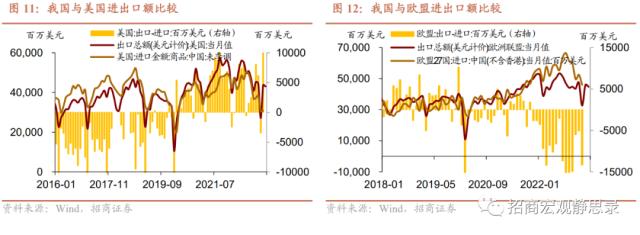
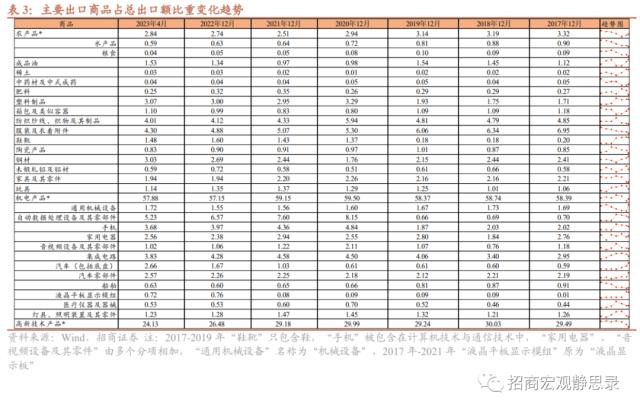
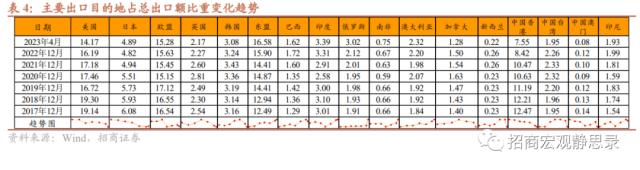
The difference between the data published by the importing country and the data published by the importing country may be more due to statistical standards, re-export trade of some products and other factors than false reporting.1) China’s exports to Singapore and Vietnam are obviously larger than the imports from China announced by the other side, which is mainly due to the existence of entrepot trade. 2) The amount of imports from China announced by the United States and the European Union is also different from the amount of trade exported to the United States and the European Union by China. In addition to the conventional factors such as differences in statistical standards, time differences and entrepot trade, China is also a big country of final consumer goods. In recent years,’s exports to the United States-the United States imports from China and China exports to the European Union-the European Union imports from China are not the same. The possible reasons are as follows: First, American importers deliberately understate their imports from China to avoid import tariff sanctions. Compared with 2016 and 2017, the difference between China’s exports to the United States and the United States imports from China since 2018 is obvious. Second, compared with other countries, the energy crisis in Europe is more serious in 2022, and the freight for the import and export of goods is obviously higher, which directly causes the EU’s import from China-China’s export to the EU to jump sharply, and other trade exchanges such as South Korea and Europe have the same trend.
The reason why export performance exceeds market expectations is more the result of diversification of export commodity structure and export destination.1) The high growth rate of export in March was mainly the comprehensive result of the release of the backlog of export orders in the previous period and the effective purchase of orders abroad. In April, export delivery value jumped from-5.4% of the previous value to 0.7%, and exports were more contributed by the shipment value produced in the current period. 2) The structure of China’s main export commodities has obviously gradually moved closer to that before the epidemic, and the advantage of complete industrial chain can indeed enable enterprises to switch commodity structures to adapt to global demand in a relatively short period of time. Compared with that before the epidemic, the contribution of automobiles (including chassis) and auto parts to the total export volume has been on the rise, which has also become the main commodity driving export growth. 3) Thanks to China’s active participation in regional trade, expansion of trade network and continuous deepening of economic and trade cooperation with non-European and American countries, the "Belt and Road", ASEAN, Russia and other non-European and American countries have significantly increased the driving force for China’s export growth.
We believe that the shift in export growth does not mean that the export growth rate will continue to decline this year.Judging from the PMI index published in China and the export base last year, we believe that the export growth rate will change gears continuously from May to July. However, there is a high probability that the annual export growth rate will still be positive, and the export growth rate from May to December will show a trend of "falling first and then rising".
main body
One,In the past, there were indeed false reports on export data, but the main reason for the high growth rate in March and April was by no means false reports.
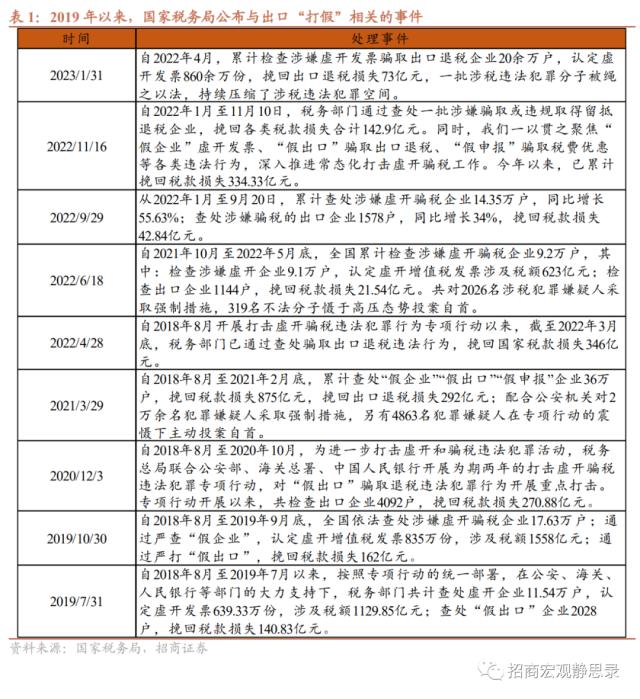
Just talking about the authenticity of the data, the State Administration of Taxation will announce the punishment of false reporting of export data and tax fraud every year, which shows that there is indeed the possibility of false reporting of export data, but it is untenable to classify the reasons for exceeding expectations in March and April as false reporting.The false export data is more for tax fraud. Since August 2018, the State Administration of Taxation, together with the Ministry of Public Security, the General Administration of Customs, the People’s Bank of China and other departments, has continued to carry out regular work to crack down on tax fraud. In the context of cracking down on export false reports, there are still criminals who falsely report export data through various means. Since the government has not published the amount of tax recovery from export tax fraud in a specific period of time in detail, we might as well calculate from the export "counterfeiting" incident announced in previous years. In April 2022, the State Taxation Bureau announced that since the special action to crack down on illegal tax fraud was launched in August 2018, by the end of March 2022, the tax authorities had recovered 34.6 billion yuan of national tax losses by investigating and dealing with illegal export tax fraud. According to this rough calculation, about 10 billion yuan of export tax rebates were recovered every year. In addition, the proportion of export tax rebate in total exports is basically maintained in the range of 8%-10%. Based on this, the accumulated amount of export false reports in January-April this year is about 34 billion-42.5 billion.Even excluding the conventional false data, the cumulative export amount from January to April this year was as high as more than 7.63 trillion yuan, and the cumulative export growth rate was about 10%, which was only 0.5 percentage points lower than the cumulative export growth rate announced by the General Administration of Customs.
In addition, at present, there are mainly two ways to falsely report exports: first, the government actively injects water to falsely report; second, enterprises forge export orders to defraud taxes; third, enterprises set up offshore companies or blend trading partners to defraud taxes through the continuous link of "exporting to domestic sales". We speculate that there are four reasons why the probability of large-scale false reporting of export data in March and April is small:
1) In March this year, the cumulative amount of export tax rebate announced by the Ministry of Finance was 553.1 billion yuan, which was significantly higher than last year’s 497.1 billion yuan. It is worth noting that the Notice of the State Council on Issues Related to Improving the Burden Mechanism of Export Tax Refund shows that since January 1, 2015, all export tax rebates (including VAT refund for export goods and VAT refund for business tax) will be borne by the central government, and the export tax rebate base originally borne by local governments in 2014 will be paid to the central government in a fixed amount. If local customs or governments cheat taxes by falsely reporting export data, they need to forge bills in multiple links. Unless the central government is willing to subsidize local governments in disguise in this way, it is difficult to escape the examination.
2) As mentioned earlier, even in the stricter export "counterfeiting" supervision, some enterprises still cheat tax refund by forging export orders, but there is no reason for enterprises to choose to focus on a large number of false reports in March and April, especially at present, they are in the downward period of exports, and the false reports of export orders of micro-enterprises are more likely to be suspected.
3) Under the background that the full invoice pilot is gradually launched and the fourth phase of golden tax is about to be launched, the tax collection and management system has gradually changed from "managing tax by votes" to "managing tax by numbers", that is, relying on big data for tax governance. Under stricter supervision, the difficulty of export tax fraud has greatly increased.
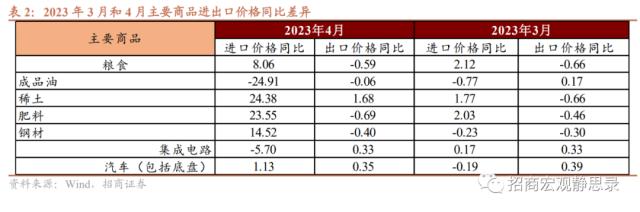
4) In addition to falsifying data, another common tax fraud method at this stage is "export to domestic sales", that is, setting up offshore companies or blending trading partners, exporting A goods abroad at a high price, and then importing A goods into China at a low price, thus earning the difference between export tax rebate and customs duties. Generally speaking, this method is not easy for micro enterprises to find, but from the breakdown data of commodities, we can see that among the main commodity structures of import and export, only the import prices of integrated circuits and refined oil in April are significantly lower than the export prices, and because the growth rate of import and export of integrated circuits is less than zero, even if there is tax fraud, it cannot be the main driving force for the overall export growth rate to exceed expectations. The difference between the import and export prices of refined oil products is mainly due to the downward trend of crude oil prices, which is far from the export tax fraud. Except for integrated circuits and refined oil products, the export prices of other commodities are often lower than the import prices, so the argument that a large number of export growth rates are pushed up by "exporting to domestic sales" is not established.
Second,Compared with industrial export delivery value, the export value is more representative of real export.
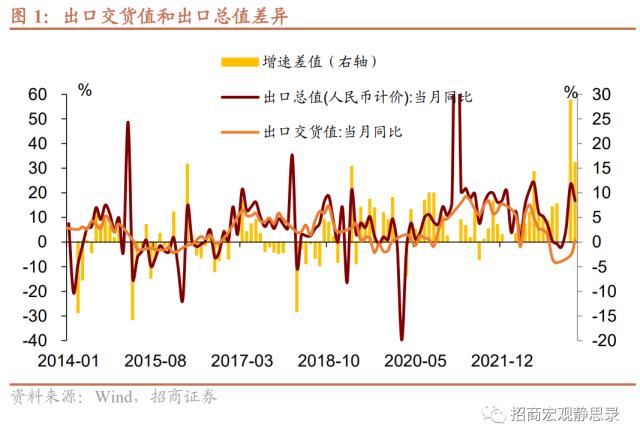
When observing exports, the market tends to pay more attention to two indicators: export delivery value and total exports. In March and April this year, the export growth rate of these two indicators showed a big deviation, and we don’t think this can be used as evidence to suspect that the export data is false.
1) The definitions of export delivery value and total exports are different.Specifically: First, the reporting period is different. export delivery value is the value of products produced in this period, handed over to foreign trade management departments or self-export in this period, while the total export value is the total value of products exported in this period, not necessarily produced in this period; Second, the statistical scope is different. export delivery value is a product (both local and foreign) produced by industrial enterprises and handed over to foreign trade management departments. The total export value is the value of products exported by all foreign trade management units and industrial enterprises. It is worth noting that some products included in export delivery value may be sold at home after being traded by foreign trade management departments, thus not being exported; Third, the calculation method is different. export delivery value only calculates the processing fee for the products processed with imported materials, while the total export amount is calculated at the full price of the exported products. Fourth, the prices are different. The products handed over to the foreign trade management department in export delivery value are calculated according to the purchase price of the foreign trade management department, and the total export amount is calculated according to the FOB price.
2) From a long period of time, the growth rate of export delivery value and the growth rate of total exports are similar, but in a short period of time, it is not uncommon for them to deviate from each other. In many months, the growth rate of total exports is higher than that of export delivery value.Compared with the total export volume, export delivery value’s statistical scope is smaller and it doesn’t necessarily include the completed export. Therefore, in academic research, the indicator of export delivery value is often used to examine whether the micro participates in the export, and the specific transaction behavior to measure the overall export still uses the export volume.
3) Compared with export delivery value, the monthly growth rate of export volume has obviously changed, which is mainly caused by the statistical method of export volume.The statistical process of import and export data of customs goods is extremely "microscopic". When the import and export goods pass through the customs, the specific consignor or consignee must declare the documents to the customs, and the customs declaration will list all kinds of basic information of the goods (such as quantity, amount, destination and other information). After obtaining these customs declarations, the customs will screen out the customs declaration data that meet the statistical conditions, and directly calculate other sub-items such as import and export data and commodity structure on this basis. In the whole process, the customs mainly plays the role of statistics, and does not need other data to calculate. In other words, the data on the customs declaration submitted by the customs will directly enter the customs database and become the basic data of the customs import and export accounting, which is also doomed to a large monthly fluctuation of export data.
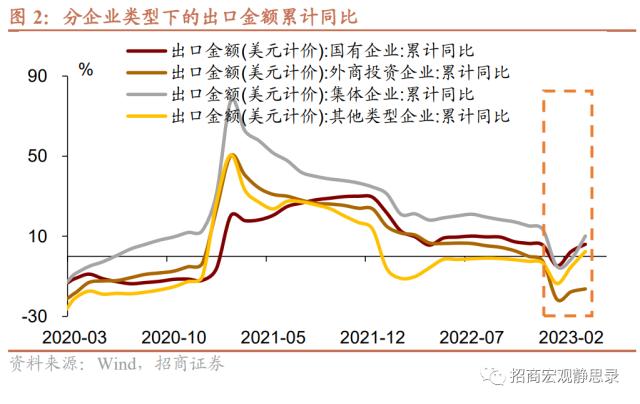
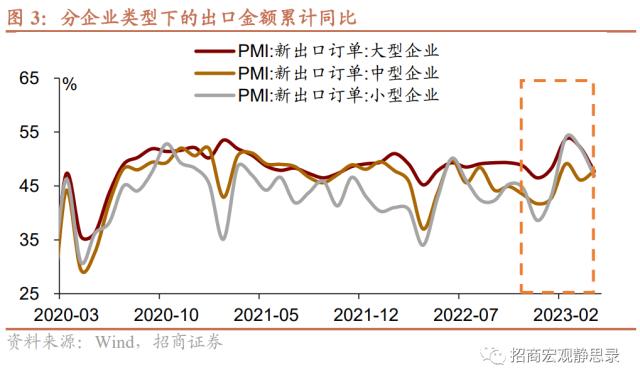
In addition, it can be seen from the export sub-items and PMI indicators that the exports in March and April did not mainly depend on the regulated industrial enterprises.According to the export data by enterprise type, compared with state-owned enterprises, collective enterprises and foreign-invested enterprises, the cumulative export of other types of enterprises (mainly private enterprises) rebounded significantly in March compared with the same period of last year. From the index of PMI new export orders, the increase of PMI new export orders of small enterprises was the most obvious in January and February, and once surpassed that of large enterprises in February. Small enterprises other than industrial enterprises are still an important force to drive exports. This can also explain to a certain extent that it is not surprising that export delivery value and the export volume deviated in March and April.
Third,Does the deviation of import and export growth rate beyond market expectations mean that the authenticity of export data is suspicious?
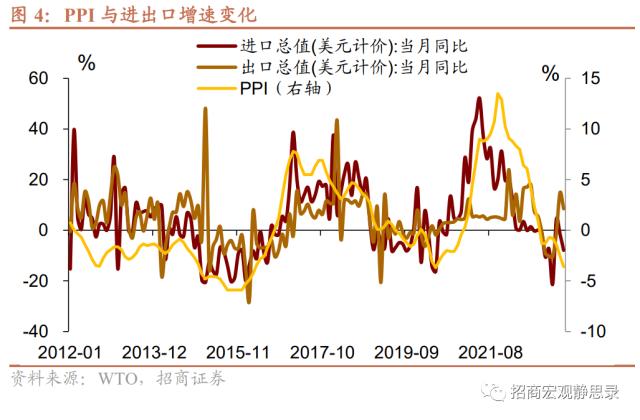
At present, China is still a major producer in the world, and the growth rates of imports and exports are synchronized in most of the time. However, because of the great differences in the structure of major commodities of imports and exports, in the case of PPI price disturbance, the growth rates of imports and exports often deviate, not only in March and April.When PPI is at a low level year-on-year, "price" has a great drag on the total import volume, and the export growth rate is often significantly higher than the import growth rate; On the contrary, when PPI is at a high level, "price" becomes the main pulling item of total imports, and the growth rate of imports is obviously higher than that of exports. At present, PPI is at a low point in the historical quantile, so it is natural that the export growth rate is greater than the import growth rate.
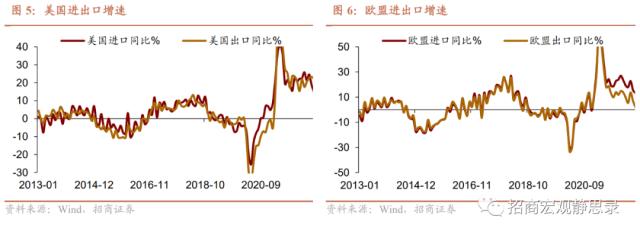
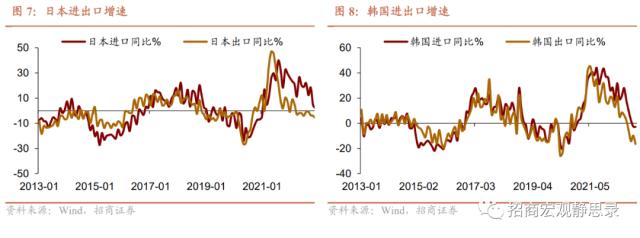
In fact, it is not only our country that the growth rate of import and export deviates, but also the United States, Japan, the European Union and South Korea, which are the main final consumer goods countries, often deviate from each other. More often, the growth rate of imports is greater than that of exports, which is mutually evidenced by China’s role as a big producer.
Fourth,The difference between the data published by the importing country and the data published by the importing country may be more due to statistical standards, re-export trade of some products and other factors than false reporting.
Because we use the total amount of FOB goods for export statistics, and the total amount of FOB goods or CIF goods for import statistics for export destinations from China, there is a gap between the two, such as freight and other expenses. Generally speaking, the total amount of China’s exports to export destinations should be less than the total amount of China’s imports from export destinations, but this is not the case.
China’s exports to Singapore and Vietnam are obviously larger than the imports from China announced by the other side, which is mainly due to the existence of entrepot trade.From the perspective of specific commodities, the difference between China and Singapore is mainly contributed by plastic products, clothing and its accessories, luggage and similar containers, furniture and its parts in labor-intensive products, household appliances, auto parts, lamps and general machinery and equipment in mechanical and electrical products, but this phenomenon does not exist in other commodities, especially high-tech commodities. The difference between China and Vietnam is mainly contributed by plastic products and textile yarns, fabrics and their products in labor-intensive products. In 2021, the total statistical difference between the two types of goods is 5.5 billion US dollars, accounting for 69% of the statistical difference of labor-intensive products in 2021.
In addition, as important countries of final consumer goods, the amount of imports from China announced by the United States and the European Union is also different from the amount of trade exported to two countries or regions by China, which is mainly caused by many factors such as statistical standards, time differences, transportation costs and tariff sanctions.From the historical data, with the end of 2019 as the dividing point, since 2020, the difference between China’s exports to the United States and the United States’ imports from China has turned from negative to positive. From the perspective of commodities, it is mainly contributed by labor-intensive plastic products, furniture and its parts, clothing and its accessories, lamps and lighting devices and their parts in electromechanical commodities and household appliances. On the contrary, the difference between China’s exports to the EU and the EU’s imports from China has been in the normal fluctuation range of positive and negative for a long time, and this difference began to turn negative in 2022. From the perspective of specific commodities, the average export value of other commodities except furniture spare parts is smaller than the EU’s imports from China, and this gap has obviously increased since 2022.In addition to the conventional factors such as differences in statistical standards, time differences and entrepot trade, China is also a big country of final consumer goods. In recent years,’s exports to the United States-the United States imports from China and China exports to the European Union-the European Union imports from China are so different. The possible reasons are as follows: First, American importers deliberately understate their imports from China to avoid import tariff sanctions. Compared with 2016 and 2017, the difference between China’s exports to the United States-the United States imports from China has shrunk significantly since 2018. Second, compared with other countries, the energy crisis in Europe is more serious in 2022, and the freight for the import and export of goods is obviously higher, which directly causes the EU’s import from China-China’s export to the EU to jump sharply. This phenomenon not only occurs in China-EU trade, but also exists in other trade exchanges such as South Korea and Europe.
Five,The reason why export performance exceeds market expectations is more the result of diversification of export commodity structure and export destination.
As previously analyzed, false export report can’t be the main driving force for the high export growth rate in March and April, so what is the main reason why China’s export growth rate has exceeded expectations when the export growth rate of other countries such as South Korea and Vietnam has obviously declined? We think there are the following factors:
1) The high export growth rate in March was mainly the comprehensive result of the release of the backlog of export orders in the previous period and the successive delivery of overseas orders.We provide two pieces of evidence: First, export delivery value in March (mainly counting the current period) was significantly narrower than that in December 2022, but the year-on-year growth rate was still negative, which indicated that the growth rate of export in March was the common result of the current and previous inventory squeeze; Second, after the liberalization of the epidemic prevention and control policy, many provinces began to organize groups to go abroad to grab orders, which directly led to a rapid increase in PMI new export orders in January and February 2023.Different from March, export delivery value jumped from-5.4% to 0.7% in April, and the export was more contributed by the shipment value produced in the current period.
2) As we mentioned in previous reports, the supply advantage of China is largely due to the integrity of the industrial chain. The integrity of the industrial chain enables domestic export enterprises to better cope with the changes in the international trade situation than other countries. We have counted the data of major export commodities since 2017. Compared with before the epidemic, the contribution of plastic products, textile yarns, fabrics and their products, shoes and boots, ceramic products, toys, automatic data processing equipment and its parts, mobile phones, audio equipment and its parts, integrated circuits, medical instruments and instruments to the overall export volume increased greatly during the epidemic. On the contrary, the contribution of agricultural products, refined oil, luggage and similar containers, steel products, wrought aluminum and aluminum products, and general machinery and equipment to the overall export volume has been significantly reduced.According to the export data of the last four months, the structure of China’s main export commodities has obviously gradually moved closer to that before the epidemic, and the advantages of complete industrial chain can indeed enable enterprises to switch commodity structures to adapt to global demand in a short time. It is worth noting that compared with before the epidemic, the contribution of automobiles (including chassis) and auto parts to the total export volume has been on the rise, and it has become the main commodity driving the export growth rate.
3) In addition to the changes in the structure of export commodities, China’s main export destinations are also more diversified.From the historical data, the manufacturing PMI in the euro zone and the manufacturing PMI in the United States are in line with the change trend of China’s export growth rate, which means that the decline of China’s export growth rate in 2023 still largely depends on the degree of economic recession in Europe and America.However, thanks to China’s active participation in regional trade, expansion of trade network and continuous deepening of economic and trade cooperation with non-European and American countries, the "Belt and Road", ASEAN and Russia have significantly increased the driving force for China’s export growth, among which ASEAN, Brazil, Russia, India, South Africa and Indonesia account for an increasing proportion of China’s total exports.As far as the export data in April is concerned, the contribution rates of Russia, ASEAN, South Africa and Brazil to the overall export growth rate are 2.14%, 0.73%, 0.28% and 0.17% respectively.
Six,The fact that the export growth rate will shift does not mean that the export growth rate will continue to decline this year.
We are in "Do you need to shift gears for export growth? It is mentioned in the article that from May to July, the export growth rate will be continuously shifted, but this does not mean that the export growth rate will continue to decline this year.From the indicators published in China, the PMI value of new export orders dropped in April, but this will not immediately lead to a sharp drop in exports in May. According to historical data, PMI new export orders are often about 2-3 months ahead of exports, so the real pressure of export growth is mainly concentrated in June and July. However, due to the high export base in May last year, we believe that the export growth rate in May will be lower than that in April.
Although compared with last year, the overall export growth rate in the whole year has been set to a downward trend, there is a high probability that the export growth rate in the whole year will still be positive. From May to December, the export growth rate showed a trend of "falling first and then rising".The absolute change of export value and the marginal change of export growth rate cannot escape three key factors: supply, demand and comparative advantage. In 2023, China’s supply advantage still exists, and the latest data released shows that the export share advantage is still better than before the epidemic. The main uncertainty that determines the specific growth rate of exports comes from the overseas demand side. At present, in the context of the global economic slowdown, China’s export commodities and export destinations have good highlights. Although the driving force of American exports to China does show a decreasing trend, the contribution of countries other than the United States to China’s exports should not be underestimated.
Risk warning:
The overseas economic recession has exceeded expectations.
The above content comes from May 17, 2023, "Is there really moisture in export data?" Report by Zhang Jingjing and Zhang Yiping.